 Mon-Fri, 9:00-17:00 (Beijing Time, UTC+8)


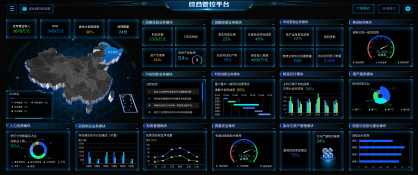
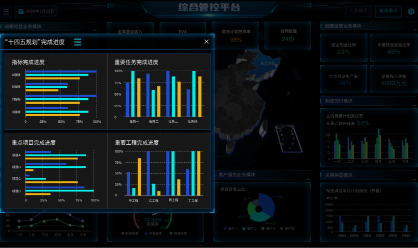
Big Data Dashboard
BDD Enterprise Data Platform: Integrates multi-source data to provide decision support.

Product Advantages

Full-stack Data Source Support
Instant access to MySQL, NoSQL, APIs, and CSV/Excel files
50+ built-in China connectors (e.g., Kingdee, Yonyou, DingTalk, WeCom)

Flexible Computing Architecture
Scales from single machine to distributed clusters, handling trillion-level data in real time
Open RESTful API and SDK for integration or custom plugin development

Scenario-based Template Ecosystem
Provides 20+ industry-specific analysis templates for retail, finance, manufacturing etc., supports users sharing custom templates
Infinite Scalability:
Connect all data domains, adapt on demand
Application Scenarios

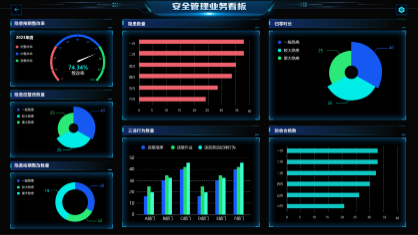
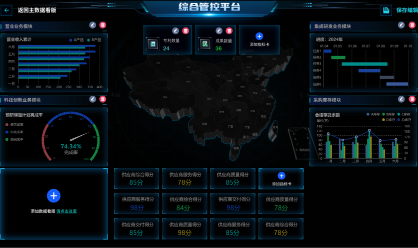
Exec Dashboard

Sales Analytics

Marketing Analysis
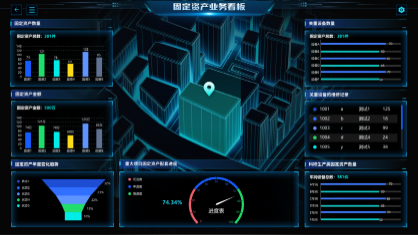
Finance Monitoring

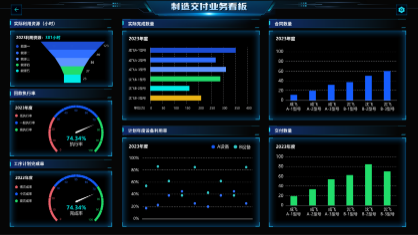
Manufacturing Monitoring
Supply Chain Management
Functional Highlights-1
The core highlight of the data management platform lies in how it transforms complex data into actionable insights, enhancing decision-making efficiency and business monitoring capabilities.
Data Integration and Centralized Display
Key Performance Indicator Visualization
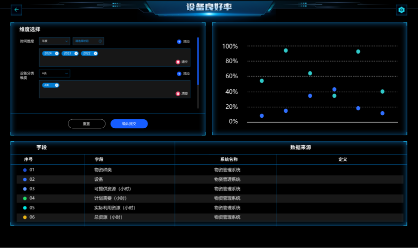
Multi-dimensional Data Exploration
Real-Time/Near Real-Time Monitoring

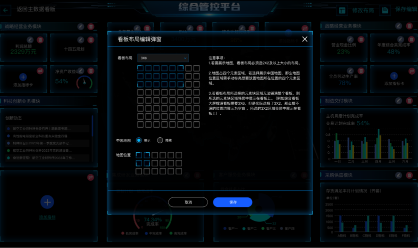
Interactive Data Exploration
Anomaly Detection and Intelligent Alerts
Functional Highlights-2
Trend Identification and Pattern Discovery
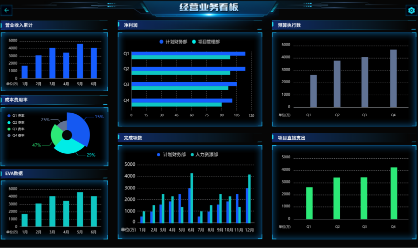
Intuitive Visual Presentation

Personalization and Role Adaptation
Mobile Access and Responsive Design

Data Storytelling
Support for Rapid Decision-Making
Core Features


Want to know more about our products?
With years serving Fortune 500 clients, we offer flexible solutions and integrated implementation.
